By Laura Carter
Over the past few weeks I have been collating published central government statistics on the numbers of single-sex and co-educational schools across the various school types and the numbers of boys and girls attending different school types throughout the period 1947-1997, in England and Wales. I will eventually follow this up with same exercise for Scotland and Northern Ireland, for which the statistics are published separately. As a research team, we agreed that the statistics would be a useful (although potentially tedious) starting point for unpacking how experiences of secondary education in postwar Britain have been shaped by gendered circumstances.
Understanding the ‘work’ done by gender in secondary schools does not come down to gender segregation in organisation alone, of course. It also encompasses gender-differentiated curricula, subject choice, career destinations, school discipline, teacher-pupil relations, and peer-to-peer relations in school. However, getting a picture of some of these patterns is crucial to enable us to think and write about everyday experiences of school, since so many of these experiences were structurally defined by whether pupils attended an all girls, all boys, or co-educational (mixed) secondary school. Indeed, one of the questions I was asked at our film screening of To Sir With Love back in January was how many secondary moderns were co-educational vs. single-sex. Although I could make an educated guess, this wasn’t good enough. As was clear from even the glamourized rendering of a secondary modern classroom in the film, gender make up mattered to what schools meant to the people working and learning in them.
In the past, I have often lazily relied on the appendices to Brian Simon’s Education and the Social Order (1991) when I have needed a headline figure of, for example, the number of pupils attending secondary modern schools in the late 1960s. Although Simon’s figures came from the same sources I have been using to compile my tables (listed at the bottom of this post), they don’t provide a breakdown of either gender school type or pupil sex. Indeed, the organisation of Simon’s statistics, oriented around school type, illustrate very pleasingly the central theme of his thesis: the rise of the comprehensive school system. Across his tables we see how, year by year, the number of pupils attending grammar, secondary modern, and technical schools dwindle, whilst the number of pupils attending comprehensive schools climbs, peaking at 3,075,523 in 1984.[1]
The blindness to gender in Simon’s account is well-known and a remedy is long overdue, which is one of the major goals of the book that will result from this project. But the statistical story especially has captured my attention because it embodies how the quite spectacular rise of co-educational secondary schooling in Britain has been wrapped up in, and therefore obscured by, the advance of comprehensivisation. In our project we hope to untangle these two things and offer a more nuanced account of their relationship from a bottom-up perspective. Below, I present a few graphs generated from the statistics I have compiled, which shed some initial light on these processes.
Graph 1: Percentage of all maintained school types that are co-educational, 1947-1977
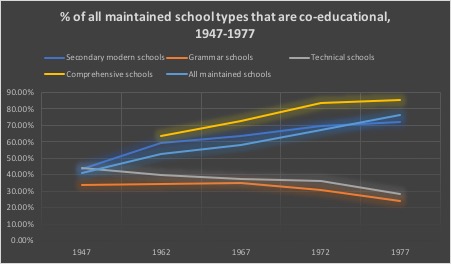
This graph shows what percentage of each different type of state-maintained secondary school was co-educational (i.e. not an all girls or an all boys school) over the period 1947-1977, the bulk of the tripartite era. The first comment to make is that England and Wales have a relatively low proportion of co-educational schools. Much of this is to do with the existing infrastructure inherited from the period before mass education, when schools were the preserve of religious institutions. The grammar schools too, most of which were much older than the Butler Act, were gender segregated: in 1947 split roughly at 1/3 boys, 1/3 girls, 1/3 co-educational. The technical schools (anyway few and far between) were also reasonably gender segregated and favoured boys, because the types of skills that they catered to mapped onto a highly gender-segregated workforce. By contrast, the secondary modern schools quickly surpassed more than 50% co-educational. One reason for this is because co-educational schools are cheaper in terms of resources, staffing, and space.
The yellow line shows the steady rise in co-educational comprehensives, which is really just the story of a rise in the number of comprehensive schools over the period. Comprehensives were bigger schools and were often literally formed through the amalgamation of existing girls’ and boys’ grammar and secondary modern schools. These schools were designed as sites of social mixing along both class and gender lines, although we hear much more about the former in both contemporary and present-day commentaries. Although secondary moderns were often places that condemned working-class kids and wasted their talents, it is worth speculating how much the new comprehensives might have actually learned and inherited from the high number of mixed secondary moderns, in relation to gender mixing.
The crossing of the two blue lines represents the point at which, in the early 1970s, there were more co-educational comprehensive schools than co-educational secondary modern schools. The grey and orange lines, representing the technical and grammar schools, drop, as we would expect, from the mid-1960s. But the drop is slightly greater than the overall decline in these school types. Co-educational grammars were the first to be axed, as the single-sex schools were typically higher performing and preferred by the middle-classes, and hence more fiercely protected in their localities. By 1977 there were only 98 mixed grammar schools in England and Wales remaining, while the overall percentage of single-sex grammar schools had increased for both girls and boys.
Graph 2: Number of single-sex maintained girls’ schools, 1947-1977

This graph shows how many girls’ schools there were in England and Wales across the period, within the different school types. Overall, it shows the expected decline of the tripartite school types and growth of comprehensives. However, it is again interesting to note how much sharper the decline in secondary modern girls’ schools was than the girls’ grammar schools, which only drop below 400 in number in the early 1970s. Single-sex schools held on much tighter throughout the period of reform. The number of girls-only comprehensives was rising, but remained low, as most new comprehensive schools were co-educational.
Although there was evidently a complex set of ideological processes at work here, involving social selection by class, ability, and gender, it is worth noting that these graphs mask some important regional and practical differences. Co-educational schools were always much more common in rural, less densely populated areas, for reasons of economy. This is part of the reason why Wales and Scotland always had more co-education than England (although unique Welsh and Scottish ideological traditions of democratic education played their part too). Northern Ireland had (and has) more gender-segregation because of the predominance of secondary schools run by religious institutions. In England, for example, most gender-segregated secondary modern schools were in urban areas because the population allowed for the greater use of space and staff. Boys’ secondary modern schools typically had better qualified staff, then the mixed secondary modern schools, then the girls’ secondary modern schools.[2]
Graph 3: Number of single-sex direct grant and independent girls’ schools, 1947-1972
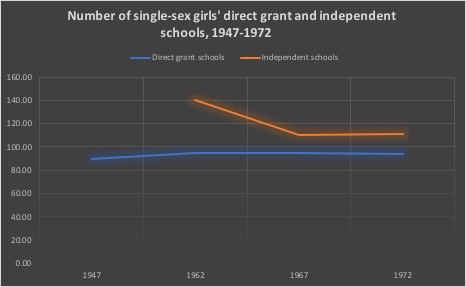
Direct grant schools could technically be included in graph 2, but they are more instructively compared to the independent sector. Both school types had very high numbers of gender-segregated schools compared to the fully state-maintained schools (in fact between 1962 and 1972 there were only ever two co-educational direct grant schools in the whole of England and Wales). Across the entirety of this period, interestingly, there were always more girls’ than boys’ direct grant schools, reflecting the dominance of girls’ Catholic schools in this sector. The comparison here is slightly tricky because the state isn’t able to collect as accurate statistics on the independent sector as on its own schools, and the numbers here completely exclude schools deemed ‘inefficient’ by the government. Nonetheless, we can see that as girls’ direct grant schools hold steadily across this period, the drop in numbers of girls’ independent schools in the 1960s (28 between 1962 and 1972) is met by a 3% rise in mixed independents and 9% rise in boys’ independent schools.
Graph 4: Numbers of girls and boys attending secondary modern vs. grammar schools, 1947-77
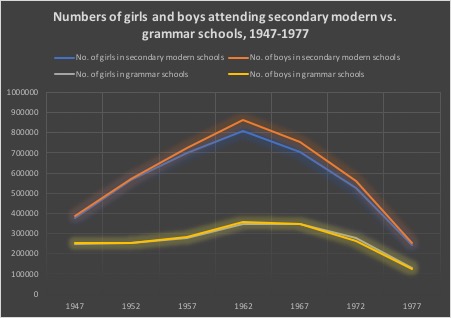
The final graph switches from thinking about numbers of schools to numbers of pupils registered in different types of schools. The government did not record detailed breakdowns of which gender school type pupils attended, so we only know, for example, how many girls were at secondary modern schools but not what proportion of these girls were at single-sex vs. co-educational secondary modern schools (although this could be worked out where needed). Nonetheless, the graph neatly illustrates that there were always more boys than girls at secondary moderns. This was probably a result of a combination of factors, including more girls attending direct grant schools and the fact that more boys typically stayed on beyond the compulsory school leaving age than did girls. The boy vs. girl lines for grammars track each other closely until the late 1960s when there are more girls at grammar schools than boys. In 1972, the year before the school leaving age was raised to 16, 51.6% of the grammar school population was female and 48.4% was male.
All of these trends need further unpacking in our work. But as a historian not trained in working with statistics, I have been surprised by how many rich questions this exercise has generated for us to take into the archives and oral history conversations. Looking at these figures alongside reading contemporaneous sociological and pedagogical studies on co-education I am struck by how clumsily concealed gender differentiation remains in our historical understanding of secondary education in Britain. This is definitely a product of the comprehensive debate: from the 1950s to the 1970s many proponents of comprehensivisation did fiercely advocate co-education as a feature of democratic mass secondary education. But the idea that girls and boys should attend school together became a kind of subsidiary point to the more pressing social debate about class, and eventually racial, mixing in secondary schools. Yet there is plenty of evidence from this earlier period to indicate that parents and pupils felt the gender make up of schools was a very important, perhaps even the most important, aspect of their school experience. This is true of both those who favoured co-education and those who did not.
It was not until the 1980s and 1990s, when feminist sociologists and educationists entered classrooms to conduct work on girls’ attainment (especially around STEM) and produced evidence of the negative social and academic effects of co-education on girls, that the gender debate was reignited on its own terms. All of this suggests to me that girls’ experiences of secondary education during the period when comprehensive schools advanced most rapidly need to be listened to more closely, since this is also the period in recent British history when women’s lives were changing drastically in relation to work, family, sex, and relationships. As always, I will post the initial outcomes of my work on gender on our ‘Resources’ page, including the full run of statistical tables for gender school type and school type attendance by sex, and I hope researchers working on other areas of postwar social history will find them informative.
Sources
Education in 1947 being the report of the Ministry of Education and the statistics of public education for England and Wales (London, HMSO: 1948)
Education in 1952 being the report of the Ministry of Education and the statistics of public education for England and Wales (London: HMSO, 1953)
Education in 1957 being the report of the Ministry of Education and the statistics of public education for England and Wales (London: HMSO, 1958)
Statistics of Education 1962, part one (London: HMSO, 1963)
Statistics of Education 1967, volume one (London: HMSO, 1968)
Statistics of Education 1972, volume one (London: HMSO, 1972)
Statistics of Education 1977, volume one (London: HMSO, 1979)
Footnotes
[1] Brian Simon, Education and the Social Order (London: Lawrence & Wishart, 1991), p. 585
[2] J. W. B. Douglas, J. M. Ross, and H. R. Simpson, All Our Future: A Longitudinal Study of Secondary Education (London: Peter Davies, 1968), p. 69